Every IT Help Desk Manager I talk to has the same remote access support story. A hybrid work employee can't connect. They open a ticket. A Level 1 support tech asks them to restart their laptop. Forty-five minutes later, the ticket escalates to Level 2, who discovers an expired certificate. The fix takes twelve seconds. The MTTR was three hours.
At ReXLytics, we built ReXGuardianCA to eliminate that entire sequence. The ReXGuardian AI Agent detects the expired certificate, diagnoses the root cause, and remediates it — all on the device, in under five seconds, without ever reaching out to a cloud service. In pilot deployments, 93% of connectivity tickets never get created.
But an expired certificate is the simple case. The harder problem — and the one that makes on-device ML inference essential — is configuration drift. Every endpoint in a fleet is a unique snowflake of registry state, GPO inheritance, driver versions, certificate chains, and network adapter configuration. That state is constantly changing. Some drift is benign: a scheduled policy update pushes a new cipher suite preference. Some drift is operational: IT rotates a gateway certificate and the client profile updates to match. And some drift is breaking: a Windows Update silently changes a firewall rule that blocks IKEv2 traffic, or a user-installed application overwrites a DNS configuration.
The challenge is that these changes all look similar at the surface level — a configuration value is different from what it was yesterday. Deterministic rules can catch known-bad states, but they can't distinguish an intentional policy update from a misconfiguration that will cause a connectivity failure in 48 hours. That's where our on-device ML models earn their place in the pipeline: they learn what normal drift looks like for a given endpoint's context and flag deviations that correlate with future connectivity failures, not just deviations from a static baseline. (I'll cover the ML architecture behind drift detection — Siamese networks, contrastive learning, and autonomous labeling — in a dedicated post.)
There's also a security dimension that most self-healing architectures ignore entirely. Configuration drift isn't always accidental. A tampered firewall rule, a silently replaced certificate, a modified DNS resolver — these are also indicators of endpoint compromise. The same ML models that detect breaking drift also surface potentially adversarial drift, routing those Findings to SIEM integration and security alerting rather than to automated remediation. The last thing you want is an autonomous agent "fixing" a configuration change that was actually the fingerprint of an attack.
This post focuses on the pipeline that makes all of this work: the detect-decide-act architecture that takes a detected problem — whether it's a simple expired cert or a subtle ML-identified drift anomaly — and safely remediates it on-device, with full policy control, rollback capability, and audit trail.
Why the Loop Must Be Local
The irony of cloud-dependent remote access troubleshooting is obvious once you say it out loud: when the remote access connection is down, you can't reach the cloud. Any architecture that depends on a SaaS backend for diagnosis or remediation has a fundamental availability gap precisely when the user needs help most.
But availability isn't the only reason we chose a fully local architecture. In the regulated industries we serve — finance, healthcare, government — shipping raw telemetry, configuration snapshots, and certificate metadata to a cloud endpoint creates privacy exposure that most CISOs won't accept. Our zero-egress design means no data leaves the device during detection, diagnosis, or remediation. The compliance story writes itself: GDPR right-to-erasure is satisfied by wiping local app data. There is no server-side copy to locate and purge.
The engineering constraint this creates is non-trivial. We needed to build a complete ML inference pipeline, a diagnostic rules engine, a policy evaluation system, a remediation executor with privilege escalation, and a rollback journal — all running within a resource budget that doesn't degrade the user's foreground experience on a standard enterprise laptop.
The Pipeline: Five Stages
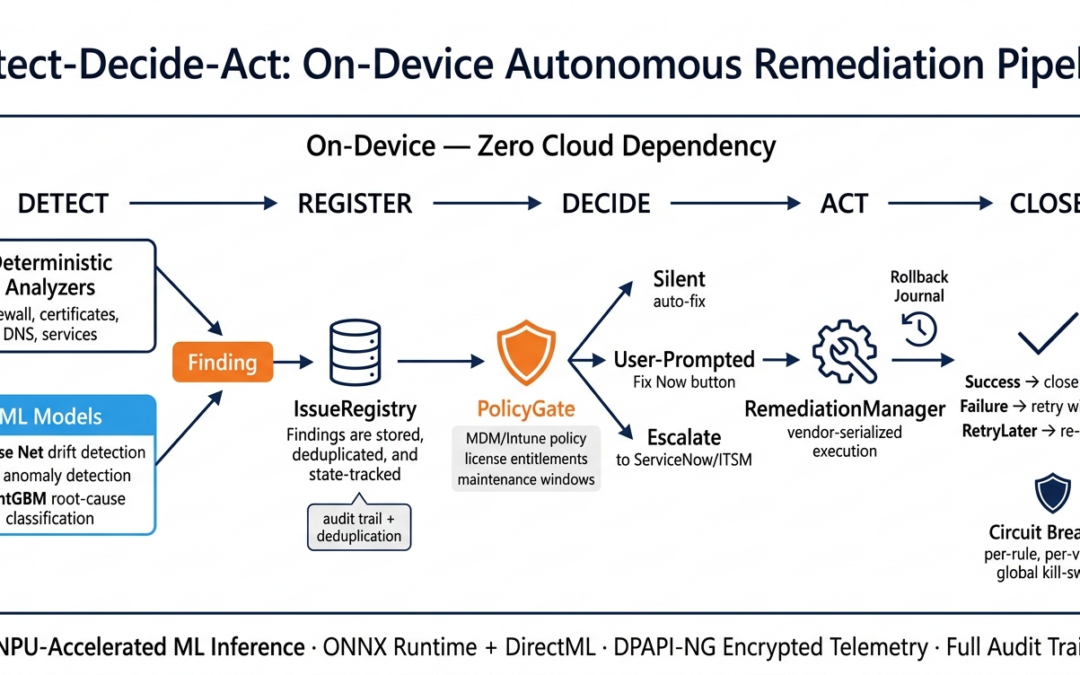
The core pipeline follows a straightforward sequence that our engineering team refers to internally as the "five-box model":
Detect → Register → Decide → Act → Close
Each stage is implemented as a distinct component with clear interface contracts, connected by an internal message bus. This separation is what makes the system extensible — you can add a new detector or a new remediation without touching the orchestration layer.
Stage 1: Detect — Analyzers and ML Models Working in Concert
Detection is split across two complementary systems that feed into the same downstream pipeline.
The first is a set of deterministic Analyzers — lightweight, stateless functions that each test for a specific condition. One checks whether the Windows Firewall is disabled. Another verifies that IKEv2 certificates haven't expired. Another inspects DNS resolution for the VPN gateway hostname. Each analyzer executes in under 100 milliseconds, is fully idempotent, and produces no side effects. They are safe to run continuously.
The second is a bank of on-device ML models that catch what deterministic rules cannot. These models — running locally via ONNX Runtime with DirectML acceleration — automatically leverage NPU silicon (Intel, Qualcomm, AMD) on Windows 11 CoPilot+ PCs when available, without code changes or rebuilds. On machines without NPU hardware, inference falls back to CPU and still completes in single-digit milliseconds for tree-based models and low tens of milliseconds for neural networks.
The critical design choice is that ML model outputs and deterministic analyzer outputs produce the exact same data structure: a Finding. This is an immutable record that carries a unique rule identifier, a vendor key (e.g., "CiscoAnyConnect" or "MicrosoftAOVPN"), a severity level, a human-readable description, structured metadata about the detected condition, and — crucially — a remediation identifier that links the detected problem to the specific fix that resolves it.
By unifying these two detection paths into a single output type, the rest of the pipeline doesn't care whether a problem was found by a handwritten rule or a neural network. That architectural decision has paid for itself many times over in reduced complexity downstream.
Stage 2: Register — The Issue Registry as Single Source of Truth
Every Finding produced by detection flows into the IssueRegistry, an in-memory store keyed on the combination of vendor key and rule identifier. This deduplication is essential — when the system runs periodic sweeps every 30 minutes alongside event-triggered analysis, the same underlying problem can be detected repeatedly. The registry collapses duplicates so that downstream components never attempt to fix the same issue twice concurrently.
The registry also serves as the audit backbone. Every state transition — open, in-progress, succeeded, failed, rolled-back — is recorded with timestamps and forwarded to the local telemetry store. This creates a complete, tamper-evident history of what was detected and what was done about it, without ever transmitting data off the device.
Stage 3: Decide — PolicyGate and the Three Execution Modes
This is the stage that separates a useful diagnostic tool from a dangerous one. Autonomous remediation on unattended enterprise endpoints is a loaded gun if you don't have rigorous policy controls around when and how fixes execute.
Before any remediation runs, the PolicyGate evaluates three layers of policy in sequence:
Endpoint security policy. This is the enterprise MDM/Intune configuration, local registry overrides, and JSON policy files that IT administrators control. PolicyGate reads these at evaluation time (not at startup) so that policy changes propagate without agent restarts. An administrator can disable automatic remediation for specific vendors, block specific fix categories during business hours, or restrict remediation entirely to user-initiated mode.
License entitlements. Each remediation carries a license feature tag. PolicyGate checks whether the endpoint's subscription tier includes that feature. This allows us to ship broad remediation capability in the agent binary while gating access through licensing — a standard enterprise pattern, but one that must be enforced locally since we can't phone home to a license server when connectivity is down.
Maintenance windows. Remediations that involve service restarts or adapter resets can briefly disrupt connectivity. PolicyGate evaluates whether the current time falls within a configured maintenance window before allowing these disruptive fixes to execute automatically. Outside maintenance windows, they queue for the next eligible window or wait for the user to click "Fix Now."
The PolicyGate evaluation produces one of three execution modes:
Silent — the fix runs automatically, without user interaction. This is the default for non-disruptive remediations (DNS cache flush, certificate renewal trigger) during maintenance windows.
User-prompted — the ReXGuardian AI Agent surfaces the Finding in the system tray with a "Fix Now" button. The user decides when to execute. This is the default for disruptive remediations outside maintenance windows.
Escalate — the agent generates a structured diagnostic report with human-readable root-cause analysis (powered by the on-device Phi Silica language model) and hands it off to ServiceNow or the configured ITSM tool. This mode activates when policy explicitly blocks automated remediation for the detected condition, or when the fix requires privileges that aren't available.
Stage 4: Act — Remediation Execution with Isolation and Elevation
Once PolicyGate approves execution, the RemediationManager takes over. This component is an asynchronous work-queue processor that enforces a critical safety property: remediations for the same vendor execute serially, but remediations for different vendors can run in parallel. This prevents two fixes from fighting each other over the same remote access client's state while still allowing a Cisco AnyConnect remediation and a Microsoft AOVPN remediation to proceed concurrently if both are needed.
Each remediation receives an execution context — a runtime container that provides OS abstractions (registry access, service control, file operations), progress reporting, and rollback registration. The key design principle is that no remediation implementation directly calls operating system APIs. Every OS interaction is mediated through the context's abstraction layer. This provides three benefits:
First, unit testability. Every remediation can be tested against mock implementations of the OS abstraction layer without requiring administrator privileges, real registry keys, or running services. Our entire remediation test suite runs in a standard CI environment with no elevation.
Second, centralized privilege escalation. When a remediation requires administrator privileges (detected via a declarative attribute on the remediation class), the context handles the elevation transparently. It proxies the operation to a lightweight system-level service host that communicates over a secured named pipe. The remediation author never writes elevation logic — it's handled once, correctly, in the infrastructure.
Third, consistent rollback registration. As each remediation step executes (stop a service, modify a registry key, replace a configuration file), the context automatically records the inverse operation in a rollback journal. If any subsequent step fails, the journal unwinds all prior changes in reverse order. This makes every remediation transactional — it either succeeds completely or leaves the system in its original state.
Individual remediations are deliberately compact — typically 20 to 50 lines of logic. The remediation for a disabled Windows Firewall, for example, checks the firewall state, enables it, verifies the change took effect, and returns a success/failure result. The orchestration, retry logic, telemetry, elevation, and rollback are all handled by the manager and context infrastructure.
Stage 5: Close — Outcomes, Circuit Breakers, and Fleet Telemetry
When a remediation completes, the outcome drives the next state:
Success marks the Finding as closed in the IssueRegistry, updates the UI to show the issue as resolved, and emits a telemetry event that feeds into the fleet-wide "Remediation Success Rate" metric.
Failure increments a retry counter and re-queues the work item with exponential back-off — up to a configurable maximum attempt count. If the maximum is exceeded, the Finding is marked as a permanent failure, and the system switches to escalation mode for that issue.
RetryLater is a distinct outcome for situations where preconditions aren't met — the device is on battery power, Wi-Fi signal is too weak, or the user is in an active video call. The work item re-queues with a configurable delay and re-evaluates preconditions on the next attempt.
The system also implements circuit breakers at three levels to prevent cascading damage from a bad remediation:
Per-rule fuse: If a specific remediation fails N times within T minutes across retries, it is quarantined. No further automatic execution until an administrator resets it or a new version of the remediation is deployed.
Per-vendor circuit: If three different remediations for the same remote access vendor all fail in quick succession, automatic remediation for that entire vendor is suspended. This catches scenarios where a vendor client update has changed behavior in a way that invalidates multiple fix assumptions simultaneously.
Global kill-switch: A remote feature flag that can disable all automatic remediation fleet-wide. This is the emergency brake for scenarios where a newly deployed remediation pack causes unexpected behavior across endpoints. It's the only component in the system that depends on cloud reachability — and it's a one-bit flag that can be cached locally, so even this degrades gracefully.
The Rollback Journal in Practice
The rollback system deserves special attention because it's what makes autonomous remediation acceptable to enterprise IT organizations that are (rightly) cautious about automated changes to endpoint configuration.
Every remediation that modifies system state registers inverse operations with the execution context as it proceeds. These registrations are persisted to the local IssueRegistry, which maintains a 24-hour window of rollback-eligible changes. The RemediationManager exposes a RollbackAll operation scoped by vendor that enumerates all successful remediations within that window and executes their inverse operations in reverse dependency order.
This reverse-ordering is important. If remediation A stopped a service and remediation B modified a configuration file that the service reads, rollback must restore the file before restarting the service. The dependency graph is maintained automatically through execution-order tracking.
The user-facing experience is simple: the WinUI 3 system tray interface shows a "Roll Back" option alongside each resolved Finding. IT administrators can trigger vendor-scoped rollback remotely through the fleet management console. Every rollback emits a full audit trail event, so there is never ambiguity about what the system changed and what was reversed.
Concurrency Model
One question I get frequently from engineering peers is how we handle concurrency on a resource-constrained endpoint. The answer is bounded parallelism with vendor-scoped serialization.
The AnalyzerManager (which orchestrates detection) and RemediationManager (which orchestrates fixes) both run as long-lived background services. The AnalyzerManager uses a semaphore to cap concurrent analyzer execution at twice the processor count — enough parallelism to keep analysis fast across dozens of vendor-specific analyzers, but bounded so that a sweep never saturates the CPU during foreground work. Each analyzer has a configurable timeout (10 seconds by default) to prevent a hung check from blocking the pipeline.
Remediations are more conservative. Within a single vendor, execution is strictly serial — a concurrent dictionary keyed by vendor ensures that only one fix for Cisco AnyConnect (for example) runs at a time. Across vendors, work items can proceed in parallel. This model reflects the reality of remote access client state: you can safely remediate AnyConnect and AOVPN simultaneously because they manage independent state, but running two AnyConnect fixes concurrently would create race conditions on shared configuration.
The UI layer is fully decoupled from both managers. It subscribes to state-change events on the message bus and renders the current state of the IssueRegistry. The tray application never blocks on analysis or remediation — it receives events, updates its view model, and that's it.
What This Looks Like in Production
In production deployments at Fortune 1000 customers, the typical flow looks like this:
An employee's remote access connection drops. Within seconds, the StatusPoller detects the connection state change and publishes a degradation event. The AnalyzerManager fans out to all analyzers registered for the active remote access vendor plus global analyzers (DNS, routing, firewall). The ML drift detector compares the current configuration snapshot against the learned baseline. Within one to two seconds, the pipeline has produced a set of Findings — say, an expired user certificate and a DNS resolution failure.
PolicyGate evaluates both. The DNS flush is non-disruptive and clears for silent execution. The certificate renewal requires a brief reconnection and is approved for silent execution because it's within the maintenance window. Both remediations execute, the IssueRegistry records success, and the connection restores. Total elapsed time: under five seconds. The employee may not even notice the disruption.
When the same system encounters something it can't fix — a server-side configuration change, a revoked gateway certificate, a corporate firewall rule that's blocking traffic — it generates a structured diagnostic package via Phi Silica, including root-cause analysis in plain English, and pushes it to ServiceNow. The L2 engineer who picks up that ticket starts with a clear explanation of what was checked, what was ruled out, and what the probable cause is. MTTR for escalated issues dropped 70% in our deployments because the diagnostic legwork is already done.
Why This Architecture Matters
The detect-decide-act loop we've built is, at its core, a bet on a particular architectural thesis: that the right place to run intelligence for endpoint reliability is on the endpoint itself. Not in a SaaS platform that adds network latency and availability dependencies. Not in a cloud-hosted ML pipeline that requires data egress. On the device, with the data it already has, using the compute it already has.
The NPU acceleration available on modern Windows 11 CoPilot+ PCs makes this thesis more viable every quarter. The models we're running today all fit comfortably within a 200MB memory budget and return inference results in milliseconds. As NPU silicon continues to improve, we'll be able to run larger models and more sophisticated analysis without touching the CPU.
But the architecture that makes autonomous remediation safe — the PolicyGate, the rollback journal, the circuit breakers, the vendor-scoped serialization — that's not a hardware trend. That's careful systems engineering, and it's where most of the design effort went. Getting a deterministic rule to detect an expired certificate is straightforward. Getting an ML model to distinguish breaking drift from routine policy updates is harder, but tractable. Getting an enterprise IT organization to trust an autonomous agent to act on either without human approval — that requires a fundamentally different level of engineering rigor around safety, reversibility, and policy compliance.
That's the system we built. And that's why, in pilot, 93% of connectivity tickets never get created.
Emmett O'Brien leads the engineering organization behind ReXLytics' Hybrid Work ERP platform and the Edge-AI-powered ReXGuardian suite for enterprise connectivity and cybersecurity. Learn more at ReXLytics.com or connect with Emmett O’Brien on LinkedIn.